Basic HTML Version



PUTTING A BOUNCE INTO WALKING
modulus from compressing the gas inside each cell. This gas
diffuses over time, reducing load retention and causing
compression set. The thick midsoles of sports shoes naturally
take longer to breakdown than thin insole foams which is why
closed cell EVA is still widely used for them. The magnified
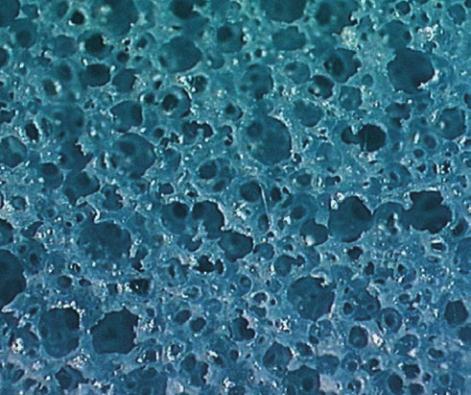
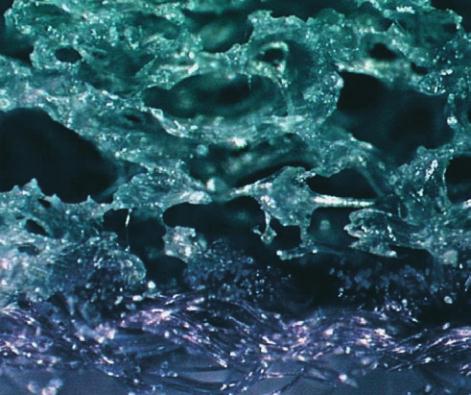
50X optical micrographs in
Figure 1
compare the uniform
structure of open cell Poron with that of a closed cell foam.
THE MECHANICS
Modulus varies depending on end use, so it is important
to offer a range of moduli for different applications. Another
key factor is change in the modulus of the foam with extent
of compression.
Figure 1
shows how compression force
deflection (CFD) relates to compression. Although foam
suppliers provide CFD at 25% compression as a measure of
softness, the weight of the person or dynamics of the
application (walking or jogging) will apply varying amounts
of compression. This can produce a modulus or hardness
value higher or lower than that at 25% compression even
though this is the design parameter. It is important that a
material’s CFD curve remains flat over a significant range of
compression to ensure the same modulus and comfort
across a wide range of physical activities. The CFD curve of a
material should therefore be used as a measure of its softness
as much as the 25% CFD value
(Figure 2)
.
Long-term or performance comfort is measured by the
compression set resistance of the foam. Compression set is
defined as the loss in thickness when compressed for a
period of time at a specific temperature. Typically, for
footwear materials, foams are compressed to 50% of original
thickness and held at room temperature or 70°C for 22 hours
(ASTM 3574 Test D). Physical activities such as walking,
jogging or running, involve varying degrees of shock or
impact on the feet, which may be transmitted to the rest of
the body. Shock or impact is one of the leading causes of
fatigue and injury in sports. Impact attenuation is a very
Fig 1a – Poron open cell foam.
Fig 2 – CFD curves for Poron Performance, Plus and Slow Rebound Materials.
CREDIT: ROGERS CORPORATION
29
Fig 1b – Typical closed cell foam.
CREDIT: ROGERS CORPORATION